Projects
StudyBuddy, a Study Group Finder
Software Engineering Final Project
October 2025 – December 2025
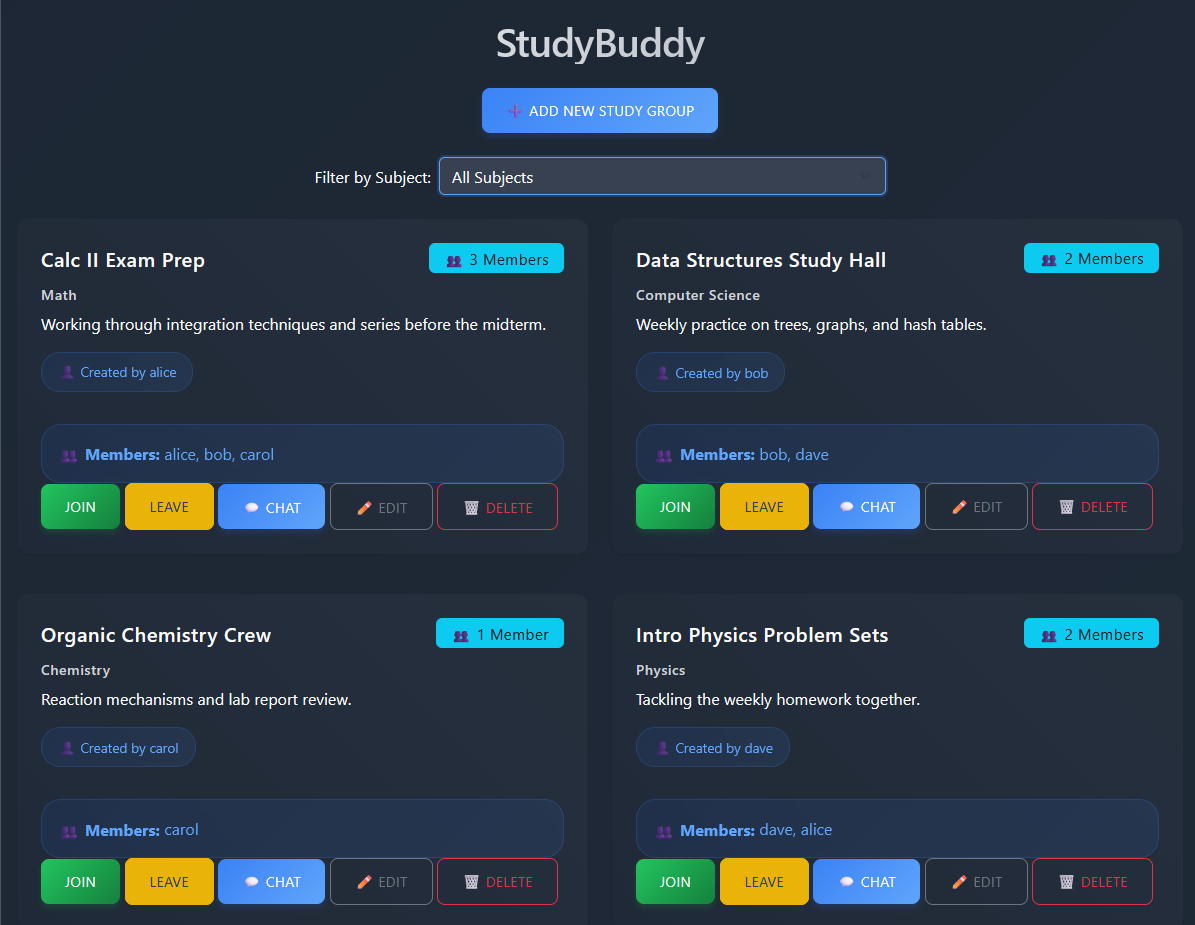
- Built StudyBuddy with a teammate: a Flask web app where students register, log in, and create, join, and manage study groups, with group chat and file sharing, a task tracker, and video meeting links.
- Migrated the app’s database from SQLite to MongoDB Atlas with PyMongo, moving users, groups, messages, and tasks to the cloud.
- Fixed a permissions bug that let non-creators edit groups, limiting editing and deleting to each group’s creator.
- Worked across three Agile sprints with Git and GitHub, and handled final debugging before the class presentation.
Python
Flask
MongoDB
HTML
Bootstrap
Git
SpaceX Falcon 9 Rocket Landings
IBM Data Science Professional Certificate · Applied Data Science Capstone
July 2025
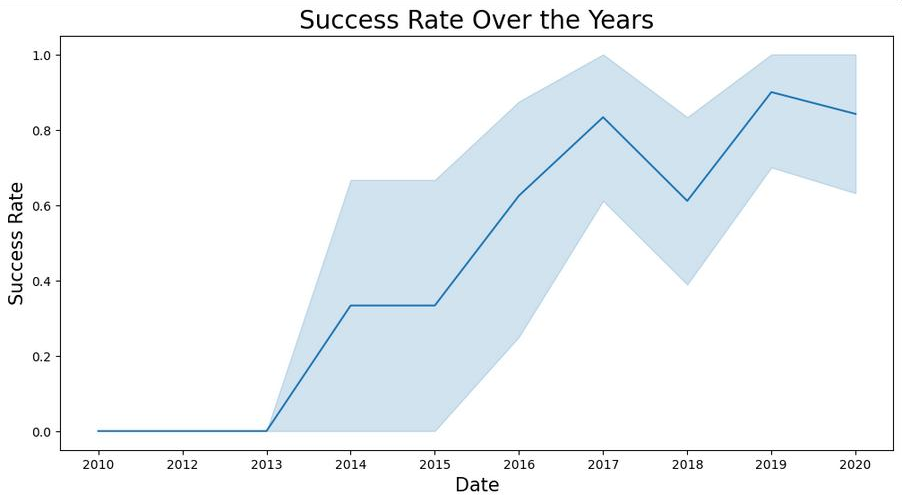
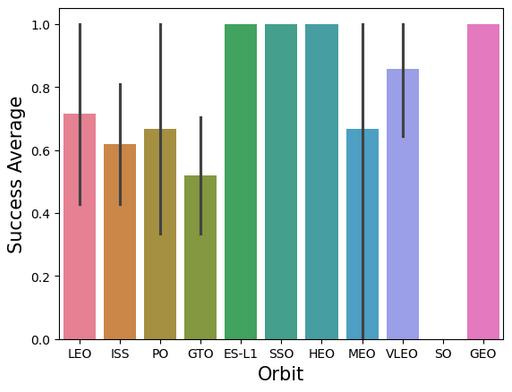
- Prepared and analyzed Falcon 9 launch data in Python to identify the key launch parameters that predict first-stage landing success.
- Built interactive visualizations with Plotly and Seaborn to explore how launch parameters relate to landing outcomes.
Python
pandas
Plotly
Seaborn
Jupyter
Analyzing Website Data with The GRAMMYs
The Global Career Accelerator
July 2024 – August 2024
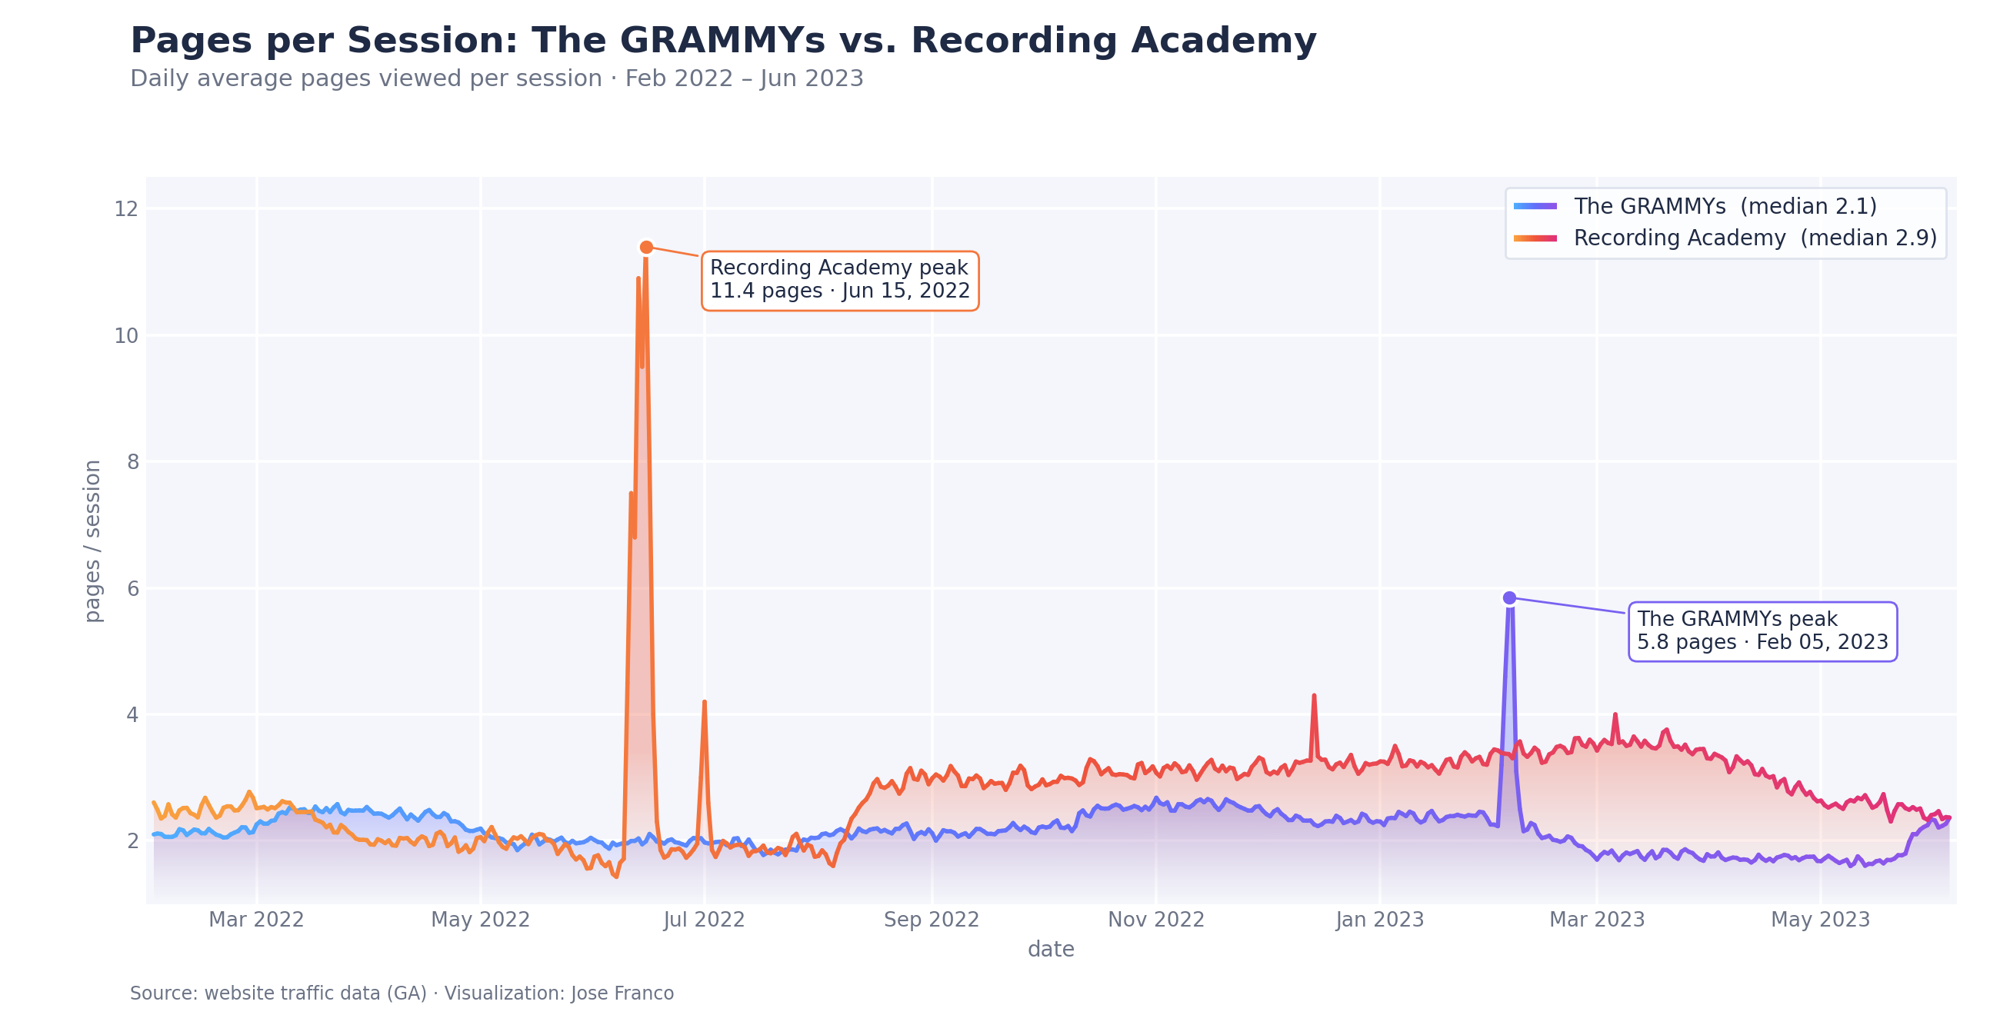
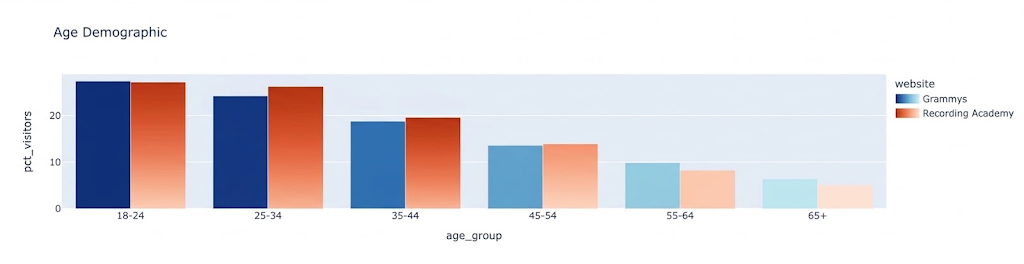
- Identified key trends and user behaviors using Python to inform content strategy and promotional initiatives by analyzing and interpreting website traffic data for The GRAMMYs.
- Analyzed critical performance metrics with pandas, uncovering patterns and identifying areas for improvement, leading to enhanced user engagement and site optimization.
- Conducted thorough benchmarking and competitive analysis, identifying growth opportunities and strategic advantages to position The GRAMMYs ahead of competitors.
- Developed dynamic, interactive data visualizations using Plotly, delivering actionable insights to GRAMMYs stakeholders and facilitating data-driven decision-making.
Python
pandas
Plotly
NumPy
Intel Sustainability Project
The Global Career Accelerator
June 2024 – July 2024
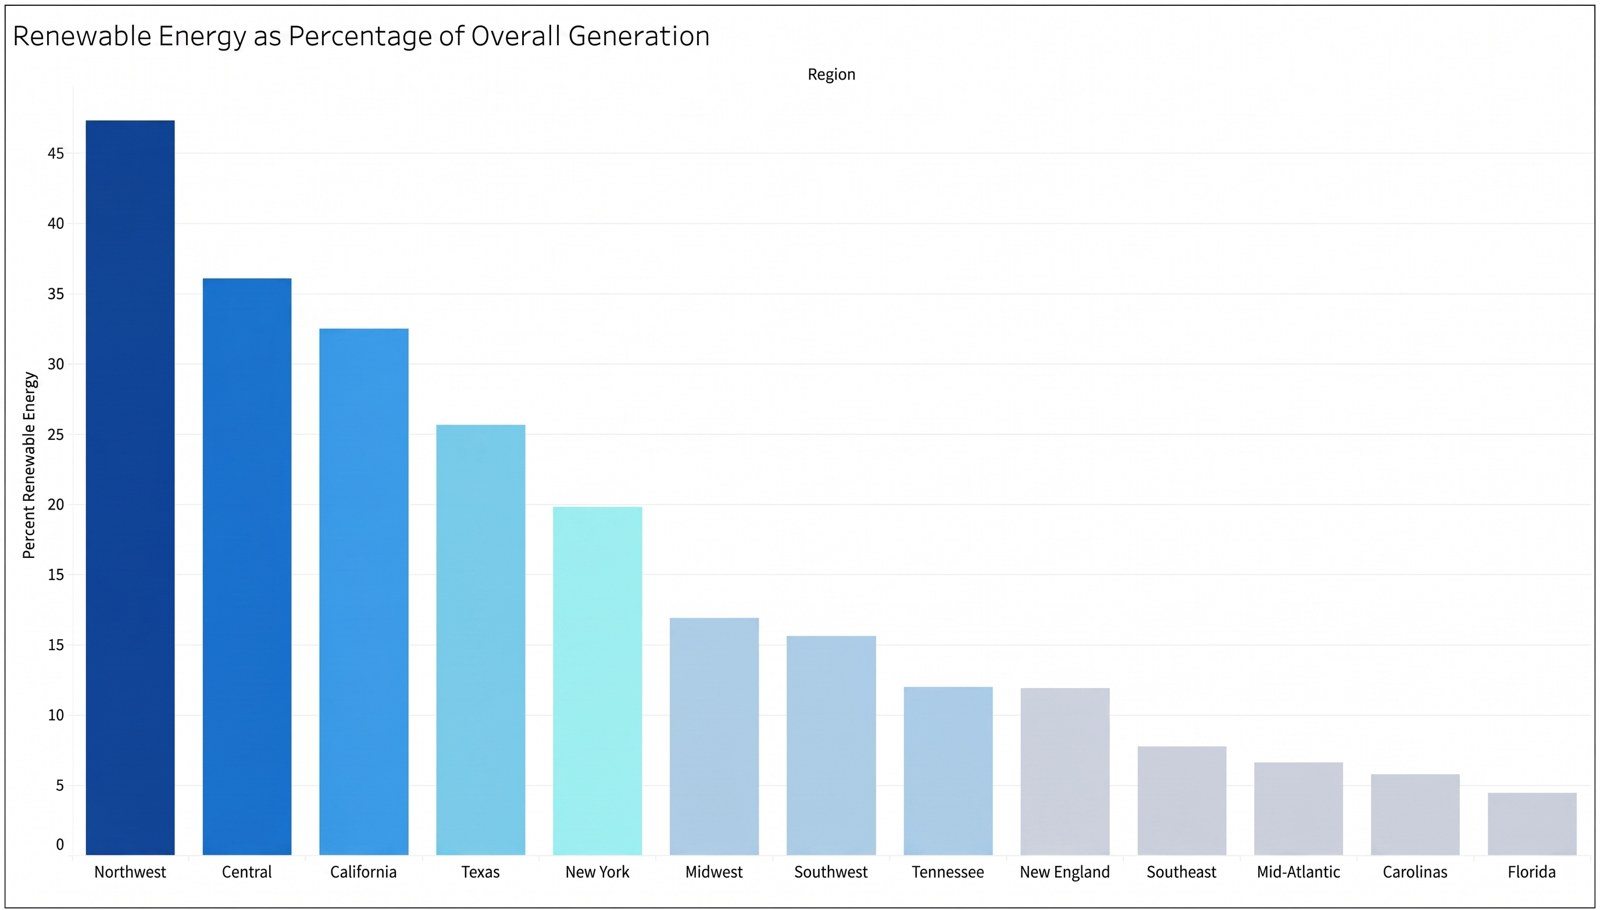
- Conducted thorough research using complex SQL queries to determine the best locations for new data centers based on energy availability and sustainability requirements.
- Generated sensible conclusions and suggestions to guide the selection of sustainable and energy-efficient sites in decision-making processes.
- Found ways to maximize the use of energy in data center operations and to harness renewable energy sources, which helped Intel meet its commitment to sustainability goals.
- Identified places where energy output is excess, which might result in lower energy procurement costs for newly operating data centers.
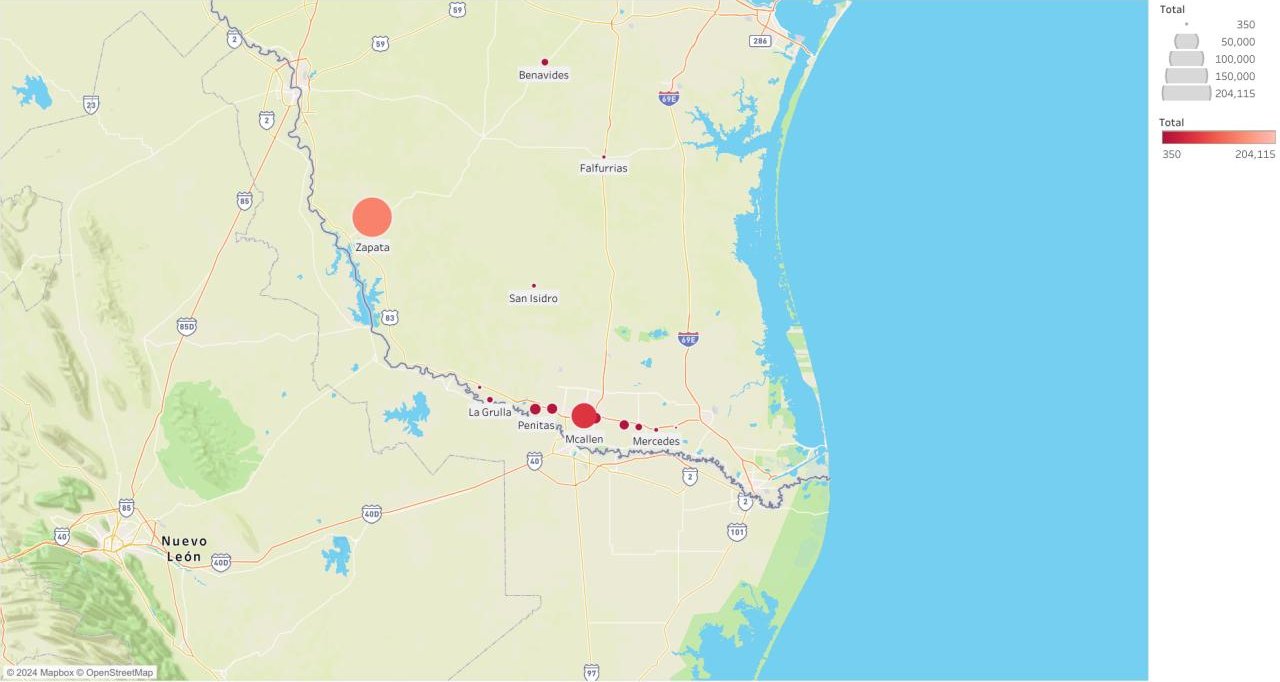
- Contributed significantly to Intel’s sustainability efforts by offering data-driven insights on adoption tactics for renewable energy, all visualized on Tableau.
SQL
Tableau
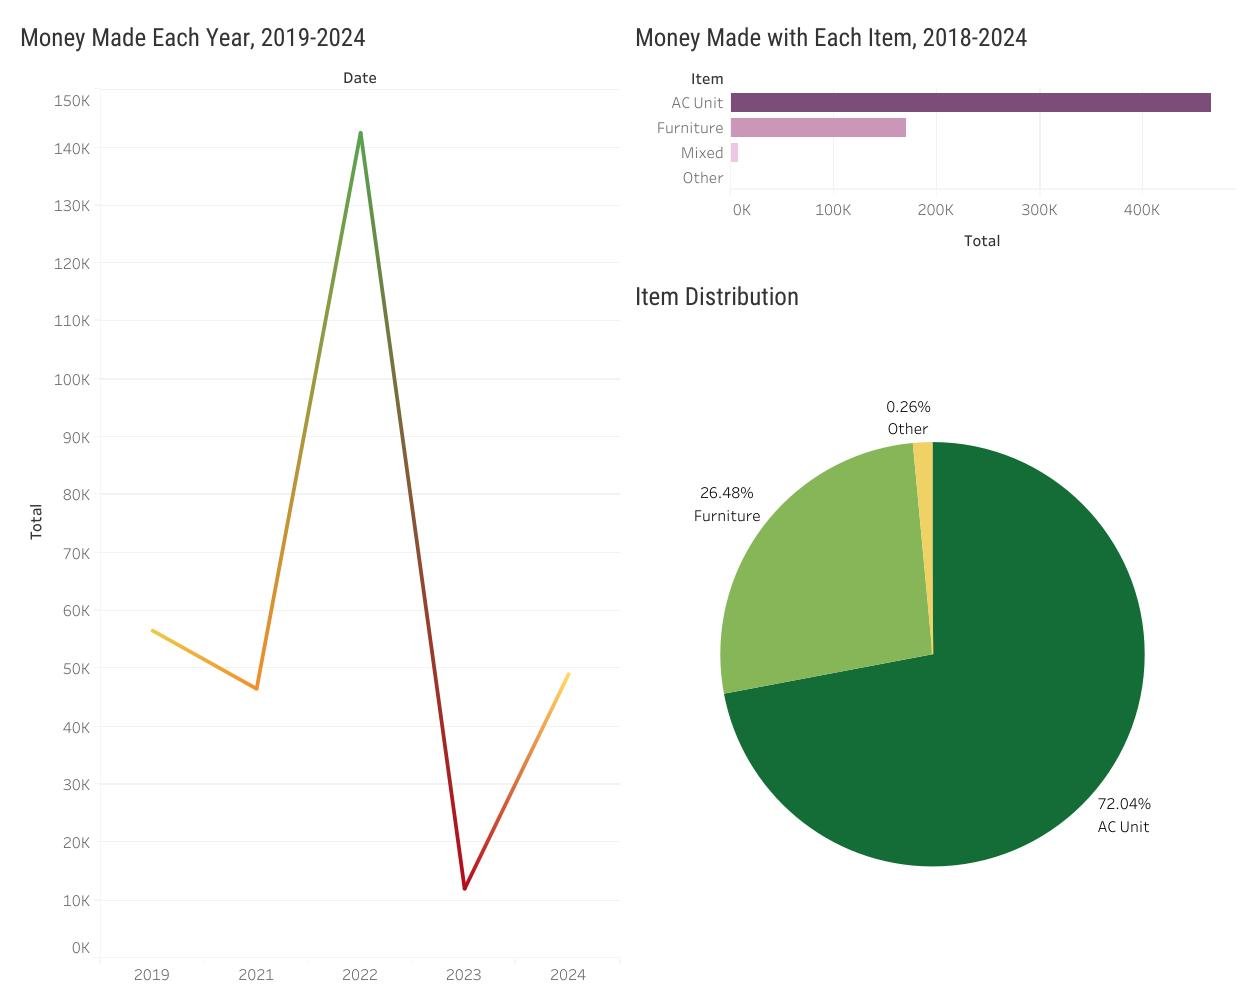
Company Data Analysis
May 2024
- Created and managed a SQL database of over 15,000 rows to support structured, governed data access for sales and performance analysis.
- Developed automated Python pipelines for data cleaning, transformation, and storage, ensuring consistent data quality and traceability.
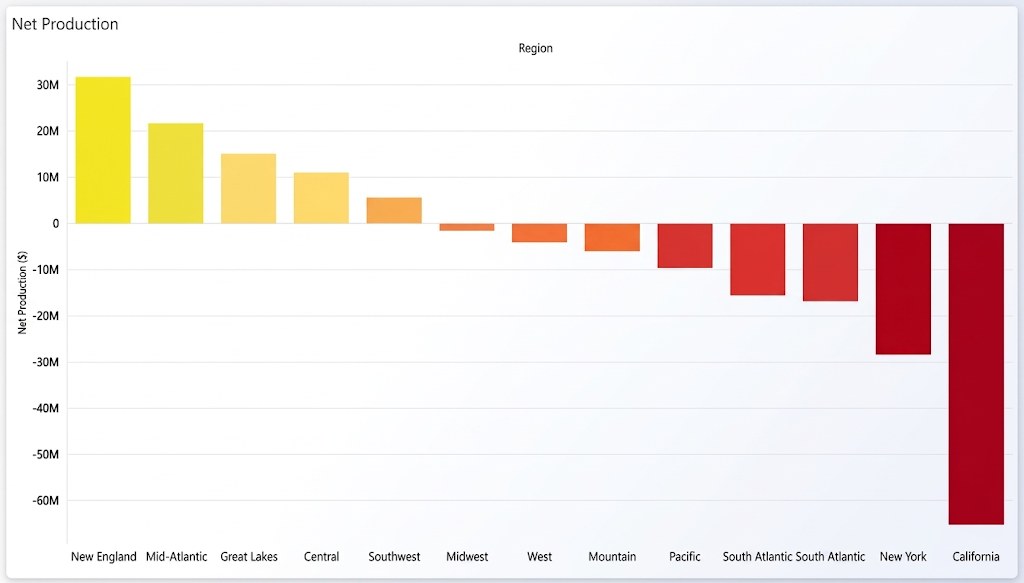
- Built Tableau reports for sales, customer behavior, and performance trends, aligning visualizations with internal business data strategies.
SQL
Python
Tableau