Experience

Data Analyst
University Lands
- Build and maintain SSRS reports and Power BI dashboards tracking well performance and oil and gas production data for operations and accounting teams.
- Partnered with accounting to build a Power BI dashboard tracking operator payment variances, identifying about 1,000 discrepancies from a single operator over the past year and recovering roughly $5,000.
- Developed the company’s first cross-application reconciliation report comparing property numbers across 30,000 wells in the accounting and land administration systems, identifying 18,000 unmatched records with 100% accuracy.
- Leading query optimization for accounting’s Power BI dashboards to resolve memory errors during refresh.
Data Analyst Intern
University Lands
- Built an SSRS governance dashboard tracking usage, run times, errors, subscriptions, datasets, and data sources across 500 reports, revealing that 80% (about 400) were unused.
- Designed a custom Complexity Score based on datasets, data sources, and query length to rank the ~100 active reports by migration effort.
- Developed an SSIS monitoring dashboard for 200 packages tracking success and failure, run durations, and job history, with a step-by-step diagnostic of each failure.
- Built a keyword-based error classifier that condensed long SSIS error logs into two-word categories, cutting diagnosis time from about 10 minutes to a few seconds.

Quality Assurance Analyst Intern
Kemper
- Built a Power BI dashboard logging application activity for about 10,000 users, flagging roughly 15 anomalies such as after-hours logins.

IT Support Technician
Rio Bank
- Provided first-level support to 100+ users, escalating complex network and software issues.
- Monitored system access logs to keep user permissions aligned with security standards.
Research Assistant
Machine Intelligence Lab, UTRGV
- Tracked project milestones and led a team of 3 researchers to keep research timelines on track.
- Ran ad-hoc data analysis in Python to refine model parameters.
Tutor
The Learning Center at UTRGV
- Led 20+ study sessions on data structures and algorithms for a cohort of 30+ students, resulting in a 15% average improvement in exam scores.
- Mentored classmates in debugging and algorithmic problem-solving, increasing group project efficiency and peer engagement by 25%.

Data Science Intern
Elsa Economic Development Corp.
- Extracted and analyzed regional economic datasets, generating insights that guided city development strategies.
- Built and deployed 15+ Tableau dashboards for city leadership.
Education
B.S. Computer Science
University of Texas Rio Grande Valley
3.82 GPA. Expected graduation December 2026.

IBM Data Science Professional Certificate
IBM (Coursera)
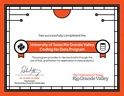
UTRGV Coding for Data Track
Global Career Accelerator
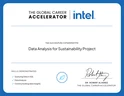
Intel Project: Data Analysis for Sustainability
Global Career Accelerator
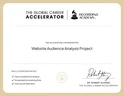
GRAMMYs Project: Website Audience Analysis
Global Career Accelerator
Skills
Languages
What I query, model, and script with.
- SQL (T-SQL)
- Python (pandas, NumPy)
- DAX
- C++
Reporting & BI
Where the numbers reach the people who use them.
- Power BI (Desktop, Service, Gateways)
- Power Query
- SSRS
- Tableau
- Excel
Data Engineering & Tools
What keeps data moving, scheduled, and versioned.
- SSIS
- SQL Server Agent
- SSMS
- Azure DevOps
- Git
- Jupyter
- Plotly
- Seaborn
- Linux